Market Outlook
July7, 2017
Market Cues
Domestic Indices
Chg (%)
(Pts)
(Close)
Indian markets are likely to open negative tracking SGX Nifty and global indices.
BSE Sensex
0.4
124
31,369
In the US markets, stocks saw considerable weakness during trading on Thursday.
Nifty
0.4
37
9,675
With the drop on the day, the Nasdaq and the S&P 500 fell to their lowest closing
Mid Cap
0.3
45
14,947
levels in over a month. The major averages ended the day firmly in negative
Small Cap
0.3
149
15,790
territory. The Dow slid 0.7 percent to 21,320, the Nasdaq tumbled 1 percent to
Bankex
0.5
120
26,564
6,089 and the S&P 500 slumped 0.9 percent to 2,410. The weakness on Wall Street
came following the release of a report from payroll processor ADP showing weaker
than expected private sector job growth in the month of June.
Global Indices
Chg (%)
(Pts)
(Close)
Dow Jones
(0.7)
(158)
21,320
The UK stocks declined on Thursday, in line with a selloff in global equity markets,
Nasdaq
(1.0)
(61)
6,089
as the European Central Bank added to signals that central banks in major
economies are on the path toward tighter monetary policy. The FTSE 100 shed 0.4%
FTSE
(0.4)
(30)
4
7,337
to close at 7,337, with only the financial and oil and gas sectors moving higher.
Nikkei
(0.4)
(88)
19,994
Hang Seng
(0.2)
(57)
25,465
On the domestic turf, benchmark indices settled higher with Sensex closing at record
high and Nifty settling above 9,650 on the back of strong recovery in PSU banks
Shanghai Com
0.2
5
3,212
and on the hopes of positive quarterly earnings. At close, the 30-share BSE Sensex
rose 124 points to 31,369 and the 50-share NSE Nifty gained 37 points at 9,675
Advances / Declines
BSE
NSE
on positive market breadth.
Advances
1,557
1,966
Declines
1,181
721
News Analysis
Unchanged
122
82
ONGC-HPCL deal likely to get cabinet nod soon
Detailed analysis is on Pg2
Volumes (` Cr)
Investor’s Ready Reckoner
BSE
3,873
Key Domestic & Global Indicators
NSE
24,075
Stock Watch: Latest investment recommendations on 150+ stocks
Refer Pg6 onwards
#Net Inflows (` Cr)
Net
Mtd
Ytd
FII
(1,159)
(2,055)
53,854
Top Picks
MFs
8871
4,871
40,017
CMP
Target
Upside
Company
Sector
Rating
(`)
(`)
(%)
Blue Star
Capital Goods
Buy
612
760
24.1
Top Gainers
Price (`)
Chg (%)
Dewan Housing FinanceFinancials
Buy
438
520
18.7
Indianb
303
8.1
Mahindra Lifespace
Real Estate
Buy
440
522
18.6
Navkar Corporation
Others
Buy
209
265
26.6
Prestige
267
6.9
KEI Industries
Capital Goods
Accumulate
232
258
11.4
Redington
136
6.9
More Top Picks on Pg3
Centralbk
92
5.0
Videoind
25
4.8
Key Upcoming Events
Previous Consensus
Date
Region
Event Description
Reading Expectations
Top Losers
Price (`)
Chg (%)
Jul 7, 2017
UK
Industrial Production (YoY)
(0.80)
0.20
Jul7, 2017
US
Unnemployment rate
4.30
4.30
Jswenergy
265
(4.6)
Jul 7, 2017
US
Change in Nonfarm payrolls
138.00
177.00
Network18
51
(3.6)
Jul 10, 2017
China
Consumer Price Index (YoY)
1.50
1.60
Pageind
17,380
(3.2)
Jul 12, 2017
US
Producer Price Index (mom)
(0.70)
Welcorp
105
(3.0)
More Events on Pg4
Aplltd
508
(2.2)
t July, 2017
Market Outlook
July7, 2017
News Analysis
ONGC-HPCL deal likely to get cabinet nod soon
The government is close to finalize the structure of a deal in which ONGC will
acquire 51.1% stake in HPCL. The cabinet approval for the deal is expected within
a few weeks. The petroleum ministry has given its proposal in a sealed envelope
for the cabinet’s consideration which is taken forward by the department of
investment and public asset management (DIPAM), which has a disinvestment
target of `72,500cr this year.
ONGC-HPCL deal could fetch the exchequer `26,400cr as per Thursday’s closing
prices on BSE. The deal requires approval by the cabinet, boards of directors and
shareholders of both the companies.
The is deal will integrate the two state-owned oil firms to achieve scale to compete
with global companies for hydrocarbon assets in world markets. While merger of
several oil companies was initially considered, the government finally opted for
ONGC’s acquisition of HPCL. For the deal to go through, ONGC may have to
borrow as it has cash reserves of about `13,000cr.
Economic and Political News
Tata Motors reduces commercial vehicle prices by up to 8.2%
Modi-Xi bilateral meeting wasn’t scheduled at G20 Summit: India
GST impact: TV, fridge, AC, washing machine prices may rise twice this year
Net Income Tax Collection Rises Nearly 15% In The First Quarter
Corporate News
Bhushan Steel in deep crisis, net loss widens to `1,130cr in Q4
Tata Motors reduces commercial vehicle prices by up to 8.2 per cent
Shankara Building Products hits new high; zooms 110% against IPO price
Market Outlook
July7, 2017
Top Picks
★★★★★
Market Cap
CMP
Target
Upside
Company
Rationale
(` Cr)
(`)
(`)
(%)
Strong growth in domestic business due to its leadership
in acute therapeutic segment. Alkem expects to launch
Alkem Laboratories
21,848
1,827
2,161
18.3
more products in USA, which bodes for its international
business.
We expect the company would report strong profitability
Asian Granito
1,369
455
480
5.5
owing to better product mix, higher B2C sales and
amalgamation synergy.
Favourable outlook for the AC industry to augur well for
Cooling products business which is out pacing the market
Blue Star
5,857
612
760
24.1
growth. EMPPAC division's profitability to improve once
operating environment turns around.
With a focus on the low and medium income (LMI)
consumer segment, the company has increased its
Dewan Housing Finance
13,730
438
520
18.7
presence in tier-II & III cities where the growth opportunity
is immense.
Loan growth is likely to pick up after a sluggish FY17.
Karur Vysya Bank
8,793
146
160
10.0
Lower credit cost will help in strong bottomline growth.
Increasing share of CASA will help in NIM improvement.
High order book execution in EPC segment, rising B2C
KEI Industries
1,801
232
258
11.4
sales and higher exports to boost the revenues and
profitability
Speedier execution and speedier sales, strong revenue
Mahindra Lifespace
2,259
440
522
18.6
visibilty in short-to-long run, attractive valuations
Massive capacity expansion along with rail advantage at
Navkar Corporation
2,985
209
265
26.6
ICD as well CFS augurs well for the company
Strong brands and distribution network would boost
Siyaram Silk Mills
2,076
2,214
2,500
12.9
growth going ahead. Stock currently trades at an
inexpensive valuation.
Market leadership in Hindi news genre and no.
2
viewership ranking in English news genre, exit from the
TV Today Network
1,470
247
344
39.6
radio business, and anticipated growth in ad spends by
corporates to benefit the stock.
After GST, the company is expected to see higher
volumes along with improving product mix. The Gujarat
Maruti
2,25,630
7,469
8,495
13.7
plant will also enable higher operating leverage which
will be margin accretive.
Source: Company, Angel Research,
Key Upcoming Events
Global economic events release calendar
Bloomberg Data
Date
Time
Country
Event Description
Unit
Period
Last Reported
Estimated
Jul 07, 2017
2:00 PMUK
Industrial Production (YoY)
% Change
May
(0.80)
0.20
6:00 PMUS
Unnemployment rate
%
Jun
4.30
4.30
6:00 PMUS
Change in Nonfarm payrolls
Thousands
Jun
138.00
177.00
Jul 10, 2017
7:00 AMChina
Consumer Price Index (YoY)
% Change
Jun
1.50
1.60
Jul 12, 2017
US
Producer Price Index (mom)
% Change
Jun
(0.70)
2:00 PMUK
Jobless claims change
% Change
Jun
7.30
Jul 13, 2017
5:30 PMIndia
Industrial Production YoY
% Change
May
3.10
China
Exports YoY%
% Change
Jun
8.70
9.00
Jul 14, 2017
India
Imports YoY%
% Change
Jun
33.10
India
Exports YoY%
% Change
Jun
8.30
6:45 PMUS
Industrial Production
%
Jun
-
0.30
6:00 PMUS
Consumer price index (mom)
% Change
Jun
(0.10)
0.10
12:00 PMIndia
Monthly Wholesale Prices YoY%
% Change
Jun
2.17
Jul 17, 2017
7:30 AMChina
Industrial Production (YoY)
% Change
Jun
6.50
6.50
7:30 AMChina
Real GDP (YoY)
% Change
2Q
6.90
6.80
Jul 18, 2017
2:30 PMEuro Zone
Euro-Zone CPI (YoY)
%
Jun F
1.30
6:00 PMUS
Housing Starts
Thousands
Jun
1,092.00
1,190.00
Jul 19, 2017
2:00 PMUK
CPI (YoY)
% Change
Jun
2.90
6:00 PMUS
Building permits
Thousands
Jun
1,168.00
1,205.00
Jul 20, 2017
7:30 PMEuro Zone
Euro-Zone Consumer Confidence
Value
Jul A
(1.30)
5:15 PMEuro Zone
ECB announces interest rates
%
Jul 20
-
Source: Bloomberg, Angel Research
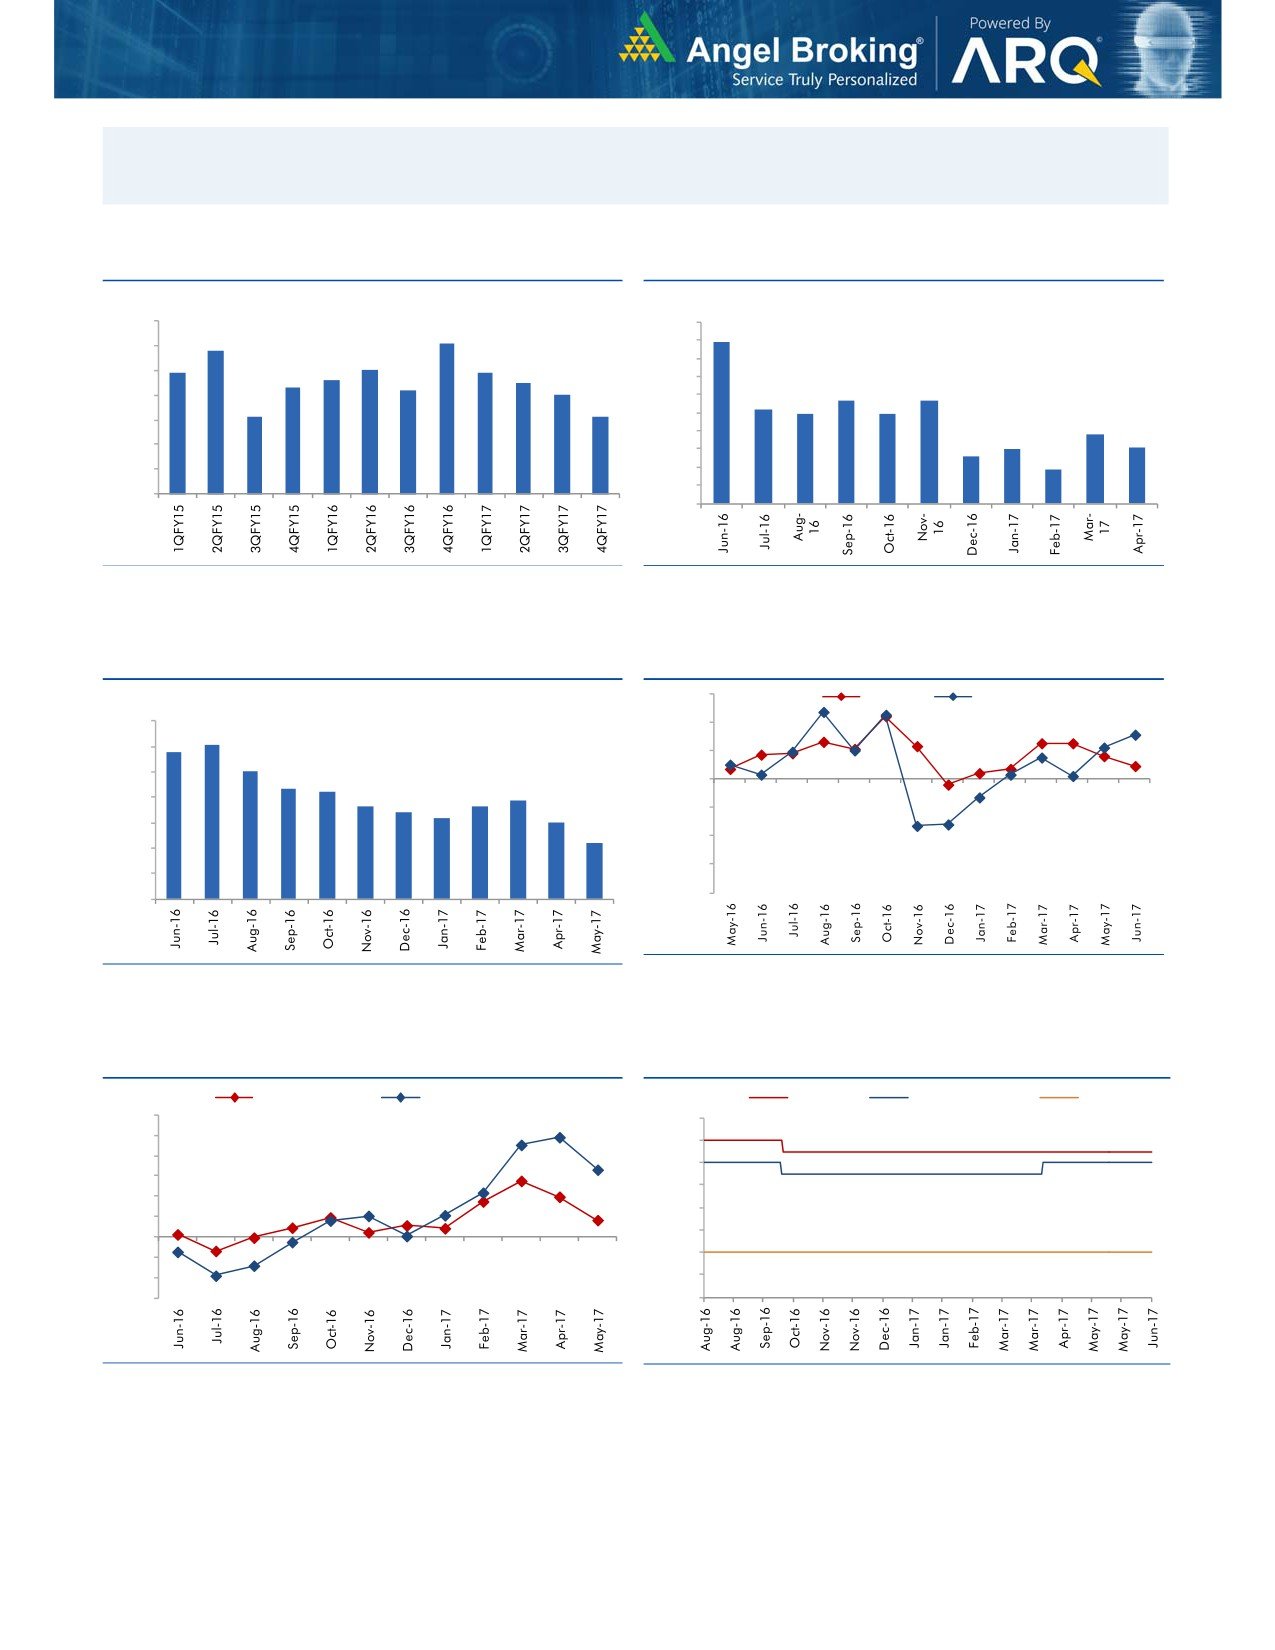
Macro watch
Exhibit 1: Quarterly GDP trends
Exhibit 2: IIP trends
(%)
(%)
10.0
10.0
9.1
8.9
8.8
9.0
9.0
7.9
8.0
7.9
8.0
7.6
7.5
8.0
7.3
7.2
7.0
7.0
5.7
5.7
6.0
5.2
7.0
6.1
6.1
4.9
4.9
5.0
6.0
3.8
4.0
3.0
3.1
5.0
2.6
3.0
1.9
4.0
2.0
1.0
3.0
-
Source: CSO, Angel Research
Source: MOSPI, Angel Research
Exhibit 3: Monthly CPI inflation trends
Exhibit 4: Manufacturing and services PMI
56.0
Mfg. PMI
Services PMI
(%)
7.0
54.0
6.1
5.8
6.0
52.0
5.1
5.0
4.3
4.2
3.9
50.0
3.6
3.7
4.0
3.4
3.2
3.0
48.0
3.0
2.2
46.0
2.0
44.0
1.0
42.0
-
Source: Market, Angel Research; Note: Level above 50 indicates expansion
Source: MOSPI, Angel Research
Exhibit 5: Exports and imports growth trends
Exhibit 6: Key policy rates
(%)
Exports yoy growth
Imports yoy growth
(%)
Repo rate
Reverse Repo rate
CRR
60.0
7.00
50.0
6.50
40.0
6.00
30.0
5.50
20.0
5.00
10.0
4.50
0.0
(10.0)
4.00
(20.0)
3.50
(30.0)
3.00
Source: Bloomberg, Angel Research
Source: RBI, Angel Research
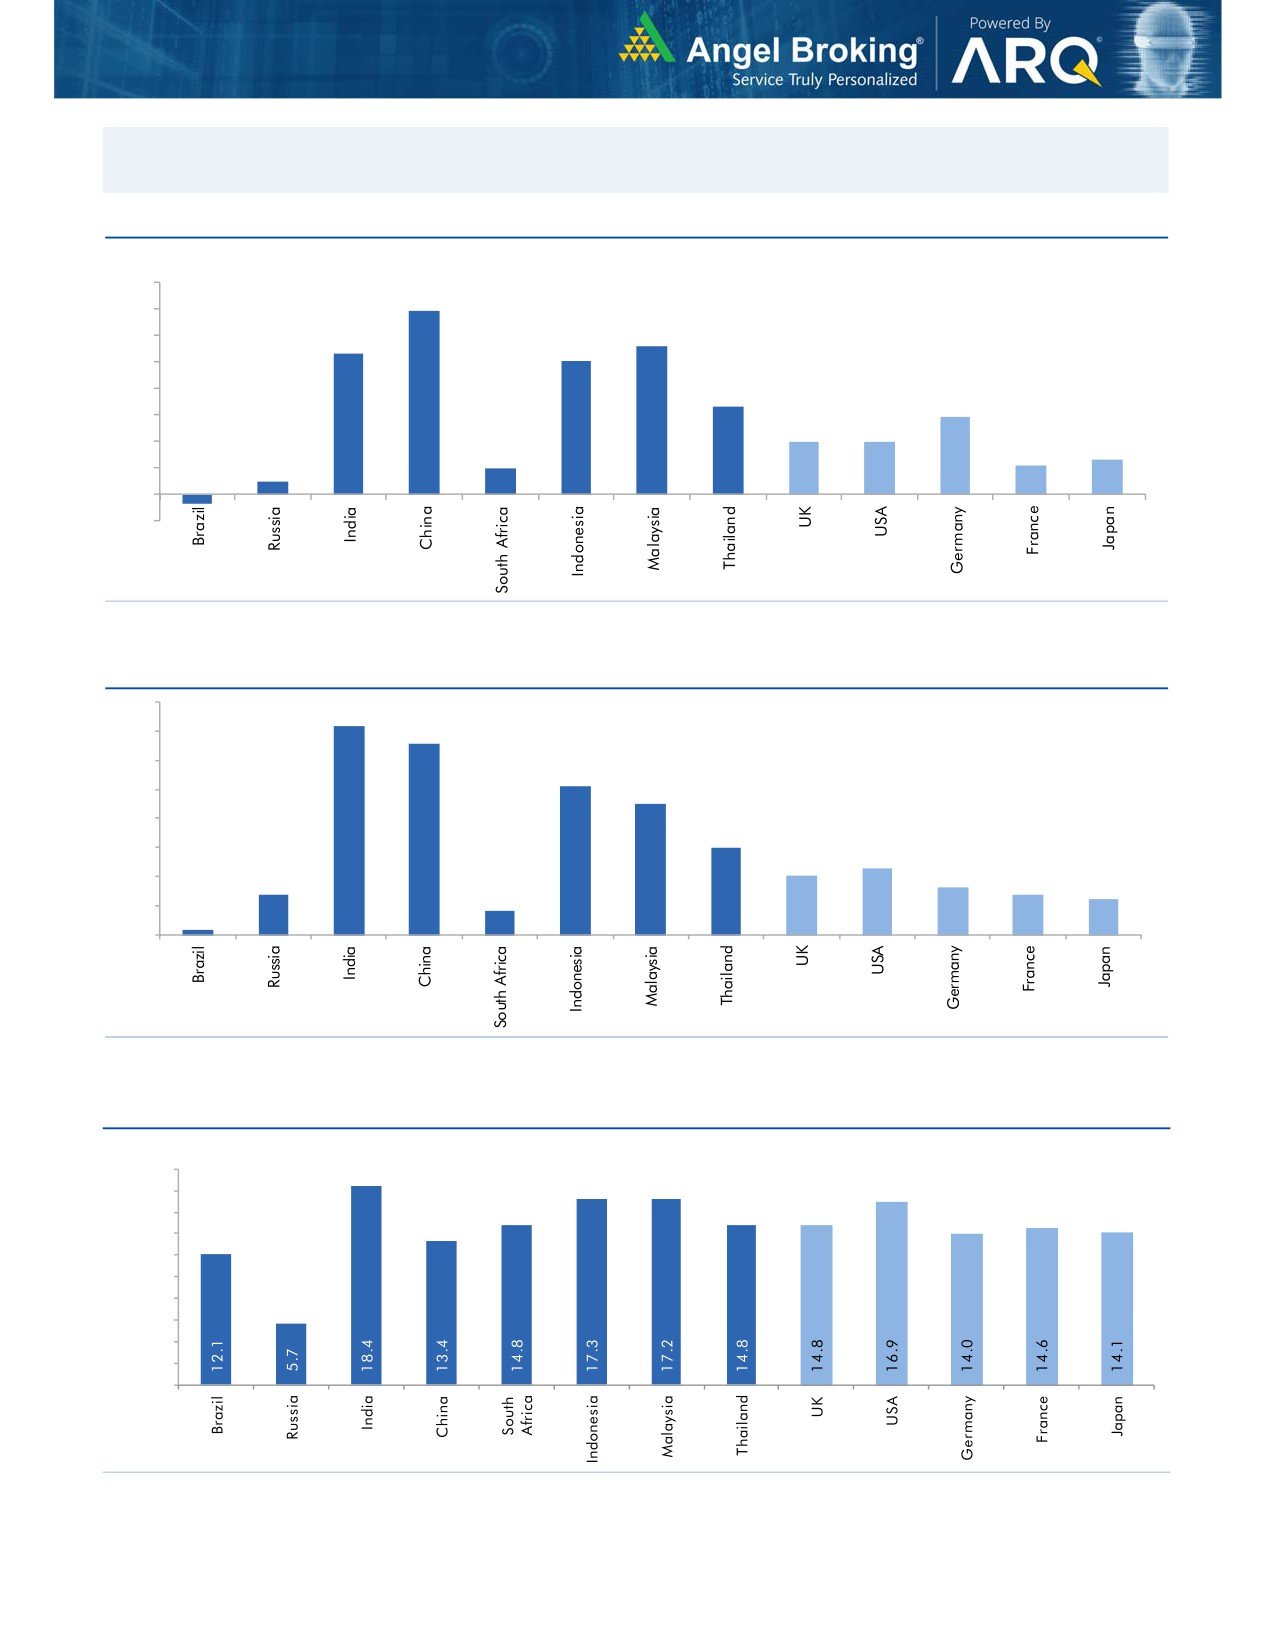
Global watch
Exhibit 1: Latest quarterly GDP Growth (%, yoy) across select developing and developed countries
(%)
8.0
6.9
7.0
5.6
6.0
5.3
5.0
1.0
5.0
4.0
3.3
2.9
3.0
2.0
2.0
0.5
2.0
1.1
1.3
1.0
-
(1.0)
(0.4)
Source: Bloomberg, Angel Research
Exhibit 2: 2016 GDP Growth projection by IMF (%, yoy) across select developing and developed countries
(%)
7.2
6.6
7.0
6.0
5.1
5.0
4.5
4.0
3.0
3.0
2.3
2.0
1.4
1.6
2.0
1.4
1.2
0.2
0.8
1.0
-
Source: IMF, Angel Research
Exhibit 3: One year forward P-E ratio across select developing and developed countries
(x)
20.0
18.0
16.0
14.0
12.0
10.0
8.0
6.0
4.0
2.0
-
Source: IMF, Angel Research, Data as of July 5th 2017
Exhibit 4: Relative performance of indices across globe
Returns (%)
Country
Name of index
Closing price
1M
3M
1YR
Brazil
Bovespa
63,154
1.0
(2.8)
20.9
Russia
Micex
1,921
2.6
(4.1)
1.7
India
Nifty
9,638
(0.0)
4.7
16.7
China
Shanghai Composite
3,207
3.6
(0.3)
12.5
South Africa
Top 40
46,241
(0.6)
2.2
0.3
Mexico
Mexbol
50,301
1.4
3.0
11.0
Indonesia
LQ45
979
3.0
6.7
19.9
Malaysia
KLCI
1,768
0.1
1.1
8.2
Thailand
SET 50
996
0.4
(0.3)
9.3
USA
Dow Jones
21,478
1.3
4.0
19.9
UK
FTSE
7,368
(2.1)
0.6
12.8
Japan
Nikkei
20,082
(0.4)
5.8
31.1
Germany
DAX
12,454
(2.7)
0.7
23.9
France
CAC
5,180
(2.7)
0.5
16.9
Source: Bloomberg, Angel Research, Data as of July 5th 2017
Stock Watch
July 07, 2017
Company Name
Reco
CMP
Target
Mkt Cap
Sales ( Čcr )
OPM(%)
EPS (Č)
PER(x)
P/BV(x)
RoE(%)
EV/Sales(x)
(Č)
Price ( Č)
( Č cr )
FY17E FY18E
FY17E
FY18E
FY17E
FY18E
FY17E
FY18E
FY17E
FY18E
FY17E
FY18E
FY17E
FY18E
Agri / Agri Chemical
Rallis
Reduce
244
209
4,742
1,937
2,164
13.3
14.3
9.0
11.0
27.1
22.2
4.7
4.1
18.4
19.8
2.5
2.2
United Phosphorus
Neutral
850
-
43,155
15,176
17,604
18.5
18.5
37.4
44.6
22.7
19.1
4.5
3.7
21.4
21.2
3.0
2.5
Auto & Auto Ancillary
Ashok Leyland
Accumulate
102
116
29,938
20,019
22,789
11.1
11.7
4.3
5.5
23.8
18.7
4.6
4.1
19.4
22.0
1.4
1.2
Bajaj Auto
Neutral
2,730
-
78,986
25,093
27,891
19.5
19.2
143.9
162.5
19.0
16.8
5.3
4.6
30.3
29.4
2.9
2.5
Bharat Forge
Neutral
1,108
-
25,787
7,726
8,713
20.5
21.2
35.3
42.7
31.4
25.9
5.8
5.2
18.9
20.1
3.4
3.0
Eicher Motors
Neutral
27,702
-
75,409
16,583
20,447
17.5
18.0
598.0
745.2
46.3
37.2
15.8
12.1
41.2
38.3
4.4
3.5
Gabriel India
Neutral
148
-
2,127
1,544
1,715
9.0
9.3
5.4
6.3
27.4
23.5
5.2
4.6
18.9
19.5
1.3
1.2
Hero Motocorp
Neutral
3,721
-
74,315
28,120
30,753
15.2
15.6
169.1
189.2
22.0
19.7
7.6
6.4
30.8
28.2
2.5
2.2
Jamna Auto Industries Neutral
260
-
2,074
1,486
1,620
9.8
9.9
15.0
17.2
17.4
15.1
3.8
3.2
21.8
21.3
1.5
1.3
L G Balakrishnan & Bros Neutral
765
-
1,201
1,302
1,432
11.6
11.9
43.7
53.0
17.5
14.4
2.5
2.2
13.8
14.2
1.0
0.9
Mahindra and Mahindra Neutral
1,377
-
85,515
46,534
53,077
11.6
11.7
67.3
78.1
20.5
17.6
3.3
2.9
15.4
15.8
1.8
1.6
Maruti
Accumulate
7,469
8,495
225,630
67,822
83,717
15.2
15.0
243.0
291.5
30.7
25.6
7.0
5.7
22.9
22.4
3.0
2.4
Minda Industries
Neutral
671
-
5,795
2,728
3,042
9.0
9.1
68.2
86.2
9.8
7.8
2.2
1.8
23.8
24.3
2.2
1.9
Motherson Sumi
Neutral
314
-
66,100
45,896
53,687
7.8
8.3
13.0
16.1
24.1
19.5
7.8
6.2
34.7
35.4
1.5
1.3
Rane Brake Lining
Neutral
1,333
-
1,055
511
562
11.3
11.5
28.1
30.9
47.4
43.1
7.2
6.6
15.3
15.0
2.2
2.0
Setco Automotive
Neutral
40
-
537
741
837
13.0
13.0
15.2
17.0
2.6
2.4
0.4
0.4
15.8
16.3
1.1
1.0
Tata Motors
Neutral
437
-
126,206
300,209
338,549
8.9
8.4
42.7
54.3
10.3
8.1
1.6
1.4
15.6
17.2
0.5
0.5
TVS Motor
Neutral
554
-
26,306
13,390
15,948
6.9
7.1
12.8
16.5
43.4
33.5
10.8
8.6
26.3
27.2
2.0
1.7
Amara Raja Batteries
Accumulate
846
962
14,443
5,339
6,220
15.9
15.3
28.0
32.3
30.2
26.2
5.8
4.9
19.1
18.5
2.7
2.3
Exide Industries
Neutral
229
-
19,427
7,439
8,307
15.0
15.0
8.1
9.3
28.2
24.6
4.0
3.5
14.3
16.7
2.2
2.0
Apollo Tyres
Neutral
256
-
13,051
12,877
14,504
14.3
13.9
21.4
23.0
12.0
11.2
1.9
1.6
16.4
15.2
1.2
1.1
Ceat
Neutral
1,883
-
7,617
7,524
8,624
13.0
12.7
131.1
144.3
14.4
13.1
2.6
2.2
19.8
18.6
1.1
1.0
JK Tyres
Neutral
169
-
3,841
7,455
8,056
15.0
15.0
21.8
24.5
7.8
6.9
1.6
1.3
22.8
21.3
0.6
0.6
Swaraj Engines
Neutral
2,350
-
2,919
660
810
15.2
16.4
54.5
72.8
43.1
32.3
13.4
12.2
31.5
39.2
4.2
3.4
Subros
Neutral
262
-
1,569
1,488
1,681
11.7
11.9
6.4
7.2
40.9
36.5
4.3
3.9
10.8
11.4
1.3
1.1
Indag Rubber
Neutral
209
-
549
286
326
19.8
16.8
11.7
13.3
17.9
15.7
3.0
2.8
17.8
17.1
1.6
1.4
Capital Goods
ACE
Neutral
75
-
739
709
814
4.1
4.6
1.4
2.1
53.4
35.6
2.2
2.1
4.4
6.0
1.2
1.1
BEML
Neutral
1,563
-
6,511
3,451
4,055
6.3
9.2
31.4
57.9
49.8
27.0
3.0
2.7
6.3
10.9
2.0
1.7
Bharat Electronics
Neutral
172
-
38,418
8,137
9,169
16.8
17.2
58.7
62.5
2.9
2.8
0.5
0.4
44.6
46.3
3.7
3.3
Stock Watch
July 07, 2017
Company Name
Reco
CMP
Target
Mkt Cap
Sales ( Čcr )
OPM(%)
EPS (Č)
PER(x)
P/BV(x)
RoE(%)
EV/Sales(x)
(Č)
Price ( Č)
( Č cr )
FY17E
FY18E
FY17E
FY18E
FY17E
FY18E
FY17E
FY18E
FY17E
FY18E
FY17E
FY18E
FY17E
FY18E
Capital Goods
Voltas
Neutral
470
-
15,550
6,511
7,514
7.9
8.7
12.9
16.3
36.4
28.8
6.6
5.8
16.7
18.5
2.1
1.8
BGR Energy
Neutral
153
-
1,102
16,567
33,848
6.0
5.6
7.8
5.9
19.6
25.9
1.1
1.1
4.7
4.2
0.2
0.1
BHEL
Neutral
136
-
33,300
28,797
34,742
-
2.8
2.3
6.9
59.2
19.7
1.0
1.0
1.3
4.8
0.8
0.6
Blue Star
Buy
612
760
5,857
4,283
5,077
5.9
7.3
14.9
22.1
41.1
27.7
8.0
6.7
20.4
26.4
1.4
1.2
CG Power and Industrial
Neutral
83
-
5,205
5,777
6,120
5.9
7.0
3.3
4.5
25.2
18.5
1.1
1.1
4.4
5.9
0.9
0.7
Solutions
Greaves Cotton
Neutral
162
-
3,956
1,755
1,881
16.8
16.9
7.8
8.5
20.8
19.1
4.2
3.9
20.6
20.9
1.9
1.8
Inox Wind
Neutral
145
-
3,228
5,605
6,267
15.7
16.4
24.8
30.0
5.9
4.9
1.6
1.2
25.9
24.4
0.6
0.5
KEC International
Neutral
256
-
6,580
9,294
10,186
7.9
8.1
9.9
11.9
25.9
21.5
3.8
3.3
15.6
16.3
0.9
0.9
KEI Industries
Accumulate
232
258
1,801
2,633
3,001
10.4
10.0
12.7
13.0
18.2
17.8
3.9
3.2
21.4
18.2
0.9
0.8
Thermax
Neutral
925
-
11,027
5,421
5,940
7.3
7.3
25.7
30.2
36.0
30.6
4.4
4.0
12.2
13.1
1.9
1.8
VATech Wabag
Neutral
681
-
3,715
3,136
3,845
8.9
9.1
26.0
35.9
26.2
19.0
3.3
2.8
13.4
15.9
1.1
0.9
Cement
ACC
Neutral
1,611
-
30,250
11,225
13,172
13.2
16.9
44.5
75.5
36.2
21.3
3.4
3.2
11.2
14.2
2.7
2.3
Ambuja Cements
Neutral
256
-
50,783
9,350
10,979
18.2
22.5
5.8
9.5
44.1
26.9
3.7
3.3
10.2
12.5
5.4
4.6
India Cements
Neutral
206
-
6,359
4,364
4,997
18.5
19.2
7.9
11.3
26.1
18.3
1.9
1.8
8.0
8.5
2.2
1.9
JK Cement
Neutral
980
-
6,851
4,398
5,173
15.5
17.5
31.2
55.5
31.4
17.7
3.8
3.3
12.0
15.5
2.1
1.8
J K Lakshmi Cement
Neutral
474
-
5,575
2,913
3,412
14.5
19.5
7.5
22.5
63.2
21.1
3.9
3.3
12.5
18.0
2.5
2.1
Orient Cement
Neutral
155
-
3,175
2,114
2,558
18.5
20.5
8.1
11.3
19.1
13.7
2.8
2.4
9.0
14.0
2.1
1.7
UltraTech Cement
Neutral
4,098
-
112,497
25,768
30,385
21.0
23.5
111.0
160.0
36.9
25.6
4.7
4.1
13.5
15.8
4.5
3.7
Construction
ITNL
Neutral
102
-
3,352
8,946
10,017
31.0
31.6
8.1
9.1
12.6
11.2
0.5
0.5
4.2
5.0
3.7
3.4
KNR Constructions
Neutral
207
-
2,915
1,385
1,673
14.7
14.0
41.2
48.5
5.0
4.3
0.9
0.8
14.9
15.2
2.2
1.8
Larsen & Toubro
Neutral
1,697
-
158,419
111,017
124,908
11.0
11.0
61.1
66.7
27.8
25.4
3.3
3.1
13.1
12.9
2.5
2.3
Gujarat Pipavav Port
Neutral
151
-
7,319
705
788
52.2
51.7
5.0
5.6
30.3
27.0
3.0
2.7
11.2
11.2
10.0
8.5
Nagarjuna Const.
Neutral
91
-
5,073
8,842
9,775
9.1
8.8
5.3
6.4
17.2
14.3
1.4
1.3
8.2
9.1
0.7
0.6
PNC Infratech
Neutral
143
-
3,671
2,350
2,904
13.1
13.2
9.0
8.8
15.9
16.3
0.6
0.5
15.9
13.9
1.7
1.4
Simplex Infra
Neutral
551
-
2,726
6,829
7,954
10.5
10.5
31.4
37.4
17.6
14.7
1.8
1.7
9.9
13.4
0.8
0.7
Power Mech Projects
Neutral
594
-
874
1,801
2,219
12.7
14.6
72.1
113.9
8.2
5.2
1.5
1.3
16.8
11.9
0.5
0.4
Sadbhav Engineering
Neutral
301
-
5,170
3,598
4,140
10.3
10.6
9.0
11.9
33.5
25.3
3.5
3.1
9.9
11.9
1.7
1.5
NBCC
Neutral
206
-
18,554
7,428
9,549
7.9
8.6
8.2
11.0
25.1
18.7
1.3
1.0
28.2
28.7
2.2
1.7
MEP Infra
Neutral
128
-
2,074
1,877
1,943
30.6
29.8
3.0
4.2
42.5
30.4
20.6
13.9
0.6
0.6
2.5
2.3
Stock Watch
July 07, 2017
Company Name
Reco
CMP
Target
Mkt Cap
Sales ( Čcr )
OPM(%)
EPS (Č)
PER(x)
P/BV(x)
RoE(%)
EV/Sales(x)
(Č)
Price ( Č)
( Č cr )
FY17E
FY18E
FY17E
FY18E
FY17E
FY18E
FY17E
FY18E
FY17E
FY18E
FY17E
FY18E
FY17E
FY18E
Construction
SIPL
Neutral
108
-
3,797
1,036
1,252
65.5
66.2
(8.4)
(5.6)
4.0
4.6
(22.8)
(15.9)
11.9
9.9
Engineers India
Neutral
156
-
10,516
1,725
1,935
16.0
19.1
11.4
13.9
13.7
11.2
1.9
1.8
13.4
15.3
5.0
4.5
Financials
Axis Bank
Accumulate
510
580
122,164
46,932
53,575
3.5
3.4
32.4
44.6
15.8
11.4
2.0
1.8
13.6
16.5
-
-
Bank of Baroda
Neutral
162
-
37,327
19,980
23,178
1.8
1.8
11.5
17.3
14.1
9.4
1.6
1.3
8.3
10.1
-
-
Canara Bank
Neutral
343
-
20,472
15,225
16,836
1.8
1.8
14.5
28.0
23.6
12.2
1.6
1.3
5.8
8.5
-
-
Can Fin Homes
Neutral
3,225
-
8,584
420
526
3.5
3.5
86.5
107.8
37.3
29.9
8.0
6.6
23.6
24.1
-
-
Cholamandalam Inv. &
Accumulate
1,134
1,230
17,721
2,012
2,317
6.3
6.3
42.7
53.6
26.6
21.2
4.2
3.6
16.9
18.3
-
-
Fin. Co.
Dewan Housing Finance Buy
438
520
13,730
2,225
2,688
2.9
2.9
29.7
34.6
14.7
12.7
2.4
1.6
16.1
14.8
-
-
Equitas Holdings
Buy
158
235
5,341
939
1,281
11.7
11.5
5.8
8.2
27.2
19.3
2.3
2.1
10.9
11.5
-
-
Federal Bank
Accumulate
116
125
22,422
8,259
8,995
3.0
3.0
4.3
5.6
26.9
20.6
2.3
2.1
8.5
10.1
-
-
HDFC
Neutral
1,647
-
262,413
11,475
13,450
3.4
3.4
45.3
52.5
36.4
31.4
7.0
6.2
20.2
20.5
-
-
HDFC Bank
Neutral
1,659
-
426,930
46,097
55,433
4.5
4.5
58.4
68.0
28.4
24.4
5.0
4.2
18.8
18.6
-
-
ICICI Bank
Accumulate
294
315
188,249
42,800
44,686
3.1
3.3
18.0
21.9
16.3
13.4
2.2
2.1
11.1
12.3
-
-
Karur Vysya Bank
Accumulate
146
160
8,793
5,640
6,030
3.3
3.2
8.9
10.0
16.4
14.6
1.7
1.6
11.2
11.4
-
-
Lakshmi Vilas Bank
Neutral
205
-
3,927
3,339
3,799
2.7
2.8
11.0
14.0
18.6
14.6
1.9
1.8
11.2
12.7
-
-
LIC Housing Finance
Neutral
752
-
37,928
3,712
4,293
2.6
2.5
39.0
46.0
19.3
16.3
3.6
3.1
19.9
20.1
-
-
Punjab Natl.Bank
Neutral
143
-
30,494
23,532
23,595
2.3
2.4
6.8
12.6
21.1
11.4
3.3
2.3
3.3
6.5
-
-
RBL Bank
Neutral
525
-
19,767
1,783
2,309
2.6
2.6
12.7
16.4
41.3
32.0
4.5
4.0
12.8
13.3
-
-
Repco Home Finance
Neutral
808
-
5,055
388
457
4.5
4.2
30.0
38.0
26.9
21.3
4.5
3.8
18.0
19.2
-
-
South Ind.Bank
Neutral
28
-
5,113
6,435
7,578
2.5
2.5
2.7
3.1
10.5
9.2
1.4
1.1
10.1
11.2
-
-
St Bk of India
Neutral
281
-
242,474
88,650
98,335
2.6
2.6
13.5
18.8
20.8
14.9
2.0
1.7
7.0
8.5
-
-
Union Bank
Neutral
153
-
10,501
13,450
14,925
2.3
2.3
25.5
34.5
6.0
4.4
0.9
0.8
7.5
10.2
-
-
Yes Bank
Neutral
1,501
-
68,651
8,978
11,281
3.3
3.4
74.0
90.0
20.3
16.7
3.9
3.3
17.0
17.2
-
-
FMCG
Akzo Nobel India
Neutral
1,837
-
8,811
2,955
3,309
13.3
13.7
57.2
69.3
32.2
26.5
10.5
8.8
32.7
33.3
2.8
2.4
Asian Paints
Neutral
1,131
-
108,457
17,128
18,978
16.8
16.4
19.1
20.7
59.2
54.6
20.6
19.4
34.8
35.5
6.3
5.6
Britannia
Neutral
3,735
-
44,827
9,594
11,011
14.6
14.9
80.3
94.0
46.5
39.7
19.1
14.8
41.2
-
4.5
3.9
Colgate
Neutral
1,107
-
30,106
4,605
5,149
23.4
23.4
23.8
26.9
46.5
41.2
25.7
20.1
64.8
66.8
6.5
5.8
Dabur India
Neutral
300
-
52,828
8,315
9,405
19.8
20.7
8.1
9.2
37.0
32.6
10.3
8.5
31.6
31.0
6.0
5.3
GlaxoSmith Con*
Neutral
5,516
-
23,196
4,350
4,823
21.2
21.4
179.2
196.5
30.8
28.1
8.2
6.9
27.1
26.8
4.7
4.2
Stock Watch
July 07, 2017
Company Name
Reco
CMP
Target
Mkt Cap
Sales ( Čcr )
OPM(%)
EPS (Č)
PER(x)
P/BV(x)
RoE(%)
EV/Sales(x)
(Č)
Price ( Č)
( Č cr )
FY17E FY18E
FY17E
FY18E
FY17E
FY18E
FY17E
FY18E
FY17E
FY18E
FY17E
FY18E
FY17E
FY18E
FMCG
Godrej Consumer
Neutral
974
-
66,346
10,235
11,428
18.4
18.6
41.1
44.2
23.7
22.0
5.3
4.4
24.9
24.8
6.6
5.8
HUL
Neutral
1,092
-
236,359
35,252
38,495
17.8
17.8
20.7
22.4
52.9
48.8
50.5
43.4
95.6
88.9
6.5
6.0
ITC
Neutral
337
-
409,063
40,059
44,439
38.3
39.2
9.0
10.1
37.5
33.2
10.5
9.1
27.8
27.5
9.7
8.7
Marico
Neutral
324
-
41,785
6,430
7,349
18.8
19.5
6.4
7.7
50.6
42.1
15.3
12.9
33.2
32.5
6.3
5.5
Nestle*
Neutral
6,925
-
66,764
10,073
11,807
20.7
21.5
124.8
154.2
55.5
44.9
22.8
20.5
34.8
36.7
6.4
5.5
Tata Global
Neutral
153
-
9,685
8,675
9,088
9.8
9.8
7.4
8.2
20.7
18.7
1.6
1.6
7.9
8.1
1.0
1.0
Procter & Gamble
Neutral
8,045
-
26,115
2,939
3,342
23.2
23.0
146.2
163.7
55.0
49.1
13.9
11.6
25.3
23.5
8.4
7.3
Hygiene
IT
HCL Tech^
Buy
840
1,014
119,903
46,723
52,342
22.1
20.9
60.0
62.8
14.0
13.4
3.6
3.0
25.3
22.4
2.3
2.0
Infosys
Buy
948
1,179
217,636
68,484
73,963
26.0
26.0
63.0
64.0
15.0
14.8
3.2
2.9
20.8
19.7
2.9
2.5
TCS
Accumulate
2,345
2,651
462,026
117,966
127,403
27.5
27.6
134.3
144.5
17.5
16.2
5.2
4.8
29.8
29.7
3.6
3.3
Tech Mahindra
Buy
376
533
36,721
29,141
31,051
14.4
15.0
32.3
35.6
11.7
10.6
2.0
1.8
17.1
17.0
1.1
1.0
Wipro
Accumulate
257
280
125,109
55,421
58,536
20.3
20.3
35.1
36.5
7.3
7.0
1.3
1.1
19.2
14.6
1.7
1.4
Media
D B Corp
Neutral
383
-
7,052
2,297
2,590
27.4
28.2
21.0
23.4
18.3
16.4
4.3
3.7
23.7
23.1
2.9
2.5
HT Media
Neutral
82
-
1,910
2,693
2,991
12.6
12.9
7.9
9.0
10.4
9.1
0.9
0.8
7.8
8.3
0.3
0.2
Jagran Prakashan
Buy
183
225
5,978
2,283
2,555
28.0
28.0
10.6
12.3
17.2
14.9
3.7
3.2
21.4
21.4
2.6
2.3
Sun TV Network
Neutral
824
-
32,455
2,850
3,265
70.1
71.0
26.2
30.4
31.4
27.1
8.0
7.1
24.3
25.6
11.0
9.5
Hindustan Media
Neutral
278
-
2,040
1,016
1,138
24.3
25.2
27.3
30.1
10.2
9.2
1.9
1.7
16.2
15.8
1.3
1.1
Ventures
TV Today Network
Buy
247
344
1,470
608
667
21.5
22.3
15.7
19.2
15.7
12.8
2.4
2.1
16.1
16.0
2.0
1.7
Metals & Mining
Coal India
Neutral
251
-
155,961
84,638
94,297
21.4
22.3
24.5
27.1
10.3
9.3
4.3
4.1
42.6
46.0
1.4
1.2
Hind. Zinc
Neutral
266
-
112,393
14,252
18,465
55.9
48.3
15.8
21.5
16.8
12.4
2.7
2.4
17.0
20.7
7.9
6.1
Hindalco
Neutral
197
-
44,094
107,899
112,095
7.4
8.2
9.2
13.0
21.4
15.1
1.0
1.0
4.8
6.6
0.9
0.9
JSW Steel
Neutral
212
-
51,318
53,201
58,779
16.1
16.2
130.6
153.7
1.6
1.4
0.2
0.2
14.0
14.4
1.7
1.5
NMDC
Neutral
113
-
35,752
6,643
7,284
44.4
47.7
7.1
7.7
15.9
14.7
1.4
1.3
8.8
9.2
3.2
2.8
SAIL
Neutral
60
-
24,657
47,528
53,738
(0.7)
2.1
(1.9)
2.6
23.0
0.7
0.6
(1.6)
3.9
1.4
1.2
Vedanta
Neutral
262
-
97,260
71,744
81,944
19.2
21.7
13.4
20.1
19.5
13.0
1.7
1.5
8.4
11.3
1.7
1.4
Tata Steel
Neutral
554
-
53,839
121,374
121,856
7.2
8.4
18.6
34.3
29.8
16.2
1.9
1.7
6.1
10.1
1.1
1.1
Oil & Gas
GAIL
Neutral
362
-
61,149
56,220
65,198
9.3
10.1
27.1
33.3
13.3
10.9
1.2
1.1
9.3
10.7
1.3
1.1
ONGC
Neutral
161
-
207,128
137,222
152,563
15.0
21.8
19.5
24.1
8.3
6.7
0.7
0.7
8.5
10.1
1.8
1.6
Indian Oil Corp
Neutral
381
-
185,229
373,359
428,656
5.9
5.5
54.0
59.3
7.1
6.4
1.1
1.0
16.0
15.6
0.7
0.6
Stock Watch
July 07, 2017
Company Name
Reco
CMP
Target
Mkt Cap
Sales ( Čcr )
OPM(%)
EPS (Č)
PER(x)
P/BV(x)
RoE(%)
EV/Sales(x)
(Č)
Price ( Č)
( Č cr )
FY17E FY18E
FY17E
FY18E
FY17E
FY18E
FY17E
FY18E
FY17E
FY18E
FY17E
FY18E
FY17E
FY18E
Oil & Gas
Reliance Industries
Neutral
1,441
-
468,681
301,963
358,039
12.1
12.6
87.7
101.7
16.4
14.2
1.7
1.5
10.7
11.3
2.0
1.7
Pharmaceuticals
Alembic Pharma
Buy
508
648
9,569
3,101
3,966
19.7
20.5
21.4
25.5
23.7
19.9
5.0
4.1
23.0
22.8
3.0
2.2
Alkem Laboratories Ltd
Buy
1,827
2,161
21,848
5,853
6,901
17.1
18.4
74.6
85.0
24.5
21.5
5.2
4.3
21.1
20.2
3.7
3.2
Aurobindo Pharma
Buy
684
823
40,051
14,845
17,086
21.5
22.1
39.4
44.7
17.4
15.3
4.3
3.4
27.6
24.7
2.9
2.5
Aventis*
Neutral
4,154
-
9,568
2,206
2,508
16.6
16.8
128.9
139.9
32.2
29.7
5.5
4.3
21.6
23.5
4.1
3.4
Cadila Healthcare
Reduce
511
450
52,272
9,220
11,584
18.4
20.3
14.5
18.7
35.2
27.3
7.5
6.1
23.5
24.6
6.0
4.6
Cipla
Sell
543
461
43,675
14,281
16,619
15.4
16.2
12.5
19.7
43.4
27.6
3.5
3.1
8.4
12.0
3.2
2.7
Dr Reddy's
Neutral
2,668
-
44,218
14,081
15,937
16.1
18.6
72.6
105.9
36.8
25.2
3.6
3.3
9.6
13.6
3.4
3.0
Dishman Pharma
Sell
143
1,718
1,890
22.7
22.8
9.5
11.3
10.1
10.9
3.3
2.9
GSK Pharma*
Neutral
2,564
-
21,714
2,927
3,290
11.8
16.2
34.4
49.6
74.5
51.7
10.8
11.2
13.9
21.3
7.2
6.5
Indoco Remedies
Sell
197
153
1,816
1,067
1,154
12.1
14.9
8.4
11.3
23.5
17.4
2.8
2.5
12.6
15.0
1.9
1.8
Ipca labs
Buy
475
620
5,995
3,211
3,593
13.9
14.5
15.4
19.4
30.9
24.5
2.4
2.2
8.2
9.5
2.0
1.7
Lupin
Buy
1,081
1,526
48,843
17,120
18,657
24.1
24.1
56.9
61.1
19.0
17.7
3.6
3.0
20.7
18.6
3.2
2.6
Natco Pharma
Accumulate
1,003
1,060
17,478
2,065
1,988
33.1
33.7
27.9
25.7
36.0
39.0
10.5
8.9
29.2
22.9
8.6
8.7
Sun Pharma
Buy
545
712
130,735
30,264
32,899
29.0
26.9
32.7
31.6
16.7
17.2
3.6
3.0
22.2
18.7
4.1
3.6
Power
Tata Power
Neutral
82
-
22,166
36,916
39,557
17.4
27.1
5.1
6.3
16.1
13.0
1.4
1.3
9.0
10.3
1.6
1.5
NTPC
Neutral
158
-
130,237
86,605
95,545
17.5
20.8
11.8
13.4
13.4
11.8
1.4
1.3
10.5
11.1
2.8
2.8
Power Grid
Accumulate
210
223
109,785
25,315
29,193
88.2
88.7
14.2
17.2
14.8
12.2
2.3
2.0
15.2
16.1
9.0
8.1
Real Estate
Prestige Estate
Neutral
267
-
10,016
4,707
5,105
25.2
26.0
10.3
13.0
25.9
20.6
2.1
1.9
10.3
10.2
3.3
2.9
MLIFE
Buy
440
522
2,259
1,152
1,300
22.7
24.6
29.9
35.8
14.7
12.3
1.1
1.0
7.6
8.6
2.7
2.3
Telecom
Bharti Airtel
Neutral
381
-
152,461
105,086
114,808
34.5
34.7
12.2
16.4
31.3
23.3
2.1
2.0
6.8
8.4
2.4
2.1
Idea Cellular
Neutral
83
-
29,750
40,133
43,731
37.2
37.1
6.4
6.5
12.9
12.7
1.1
1.0
8.2
7.6
1.8
1.5
zOthers
Abbott India
Neutral
4,278
-
9,091
3,153
3,583
14.1
14.4
152.2
182.7
28.1
23.4
138.0
117.9
25.6
26.1
2.6
2.2
Asian Granito
Accumulate
455
480
1,369
1,066
1,169
11.6
12.5
13.0
16.0
35.0
28.5
3.4
3.1
9.5
10.7
1.6
1.4
Bajaj Electricals
Buy
331
395
3,352
4,801
5,351
5.7
6.2
10.4
13.7
31.7
24.2
3.9
3.5
12.4
14.5
0.7
0.6
Banco Products (India)
Neutral
219
-
1,568
1,353
1,471
12.3
12.4
14.5
16.3
15.1
13.5
20.9
18.8
14.5
14.6
1.1
118.1
Coffee Day Enterprises
Neutral
247
-
5,096
2,964
3,260
20.5
21.2
4.7
8.0
-
30.9
2.9
2.6
5.5
8.5
2.1
1.9
Ltd
Competent Automobiles Neutral
187
-
120
1,137
1,256
3.1
2.7
28.0
23.6
6.7
7.9
36.0
32.5
14.3
11.5
0.1
0.1
Elecon Engineering
Neutral
60
-
674
1,482
1,660
13.7
14.5
3.9
5.8
15.4
10.4
3.6
3.3
7.8
10.9
0.8
0.7
Stock Watch
July 07, 2017
Company Name
Reco
CMP
Target
Mkt Cap
Sales ( Čcr )
OPM(%)
EPS (Č)
PER(x)
P/BV(x)
RoE(%)
EV/Sales(x)
(Č)
Price ( Č)
( Č cr )
FY17E
FY18E
FY17E
FY18E
FY17E
FY18E
FY17E
FY18E
FY17E
FY18E
FY17E
FY18E
FY17E
FY18E
zOthers
Finolex Cables
Neutral
486
-
7,433
2,883
3,115
12.0
12.1
14.2
18.6
34.2
26.1
18.2
15.9
15.8
14.6
2.3
2.1
Garware Wall Ropes
Neutral
863
-
1,888
863
928
15.1
15.2
36.4
39.4
23.7
21.9
4.3
3.7
17.5
15.9
2.1
1.9
Goodyear India*
Neutral
910
-
2,098
1,598
1,704
10.4
10.2
49.4
52.6
18.4
17.3
85.0
74.6
18.2
17.0
1.0
142.8
Hitachi
Neutral
1,991
-
5,415
2,081
2,433
8.8
8.9
33.4
39.9
59.6
49.9
48.1
40.1
22.1
21.4
2.6
2.2
HSIL
Neutral
413
-
2,984
2,384
2,515
15.8
16.3
15.3
19.4
27.0
21.3
26.8
23.1
7.8
9.3
1.4
1.3
Interglobe Aviation
Neutral
1,232
-
44,547
21,122
26,005
14.5
27.6
110.7
132.1
11.1
9.3
66.6
47.6
168.5
201.1
2.1
1.7
Jyothy Laboratories
Neutral
361
-
6,562
1,440
2,052
11.5
13.0
8.5
10.0
42.5
36.1
10.3
9.5
18.6
19.3
4.8
3.4
Kirloskar Engines India
Neutral
395
-
5,712
2,554
2,800
9.9
10.0
10.5
12.1
37.6
32.6
15.7
14.9
10.7
11.7
1.9
1.7
Ltd
Linc Pen & Plastics
Neutral
280
-
414
382
420
9.3
9.5
13.5
15.7
20.8
17.8
3.6
3.1
17.1
17.3
1.2
1.0
M M Forgings
Neutral
638
-
770
546
608
20.4
20.7
41.3
48.7
15.5
13.1
87.4
77.3
16.6
17.0
1.3
1.1
Manpasand Bever.
Neutral
774
-
4,430
836
1,087
19.6
19.4
16.9
23.8
45.8
32.5
5.5
4.8
12.0
14.8
5.0
3.8
Mirza International
Neutral
162
-
1,946
963
1,069
17.2
18.0
6.1
7.5
26.4
21.5
4.0
3.4
15.0
15.7
2.2
2.0
MT Educare
Neutral
65
-
260
366
417
17.7
18.2
9.4
10.8
7.0
6.1
1.6
1.4
22.2
22.3
0.6
0.5
Narayana Hrudaya
Neutral
298
-
6,080
1,873
2,166
11.5
11.7
2.6
4.0
112.5
75.0
6.9
6.2
6.1
8.3
3.4
2.9
Navkar Corporation
Buy
209
265
2,975
347
371
43.2
37.3
6.7
6.0
31.3
34.8
2.2
1.9
6.2
10.6
9.7
9.1
Navneet Education
Neutral
177
-
4,132
1,062
1,147
24.0
24.0
6.1
6.6
29.0
26.7
6.0
5.3
20.6
19.8
4.0
3.7
Nilkamal
Neutral
1,941
-
2,896
1,995
2,165
10.7
10.4
69.8
80.6
27.8
24.1
110.9
96.3
16.6
16.5
1.4
1.3
Page Industries
Neutral
17,389
-
19,395
2,450
3,124
20.1
17.6
299.0
310.0
58.2
56.1
387.3
295.6
47.1
87.5
8.0
6.3
Parag Milk Foods
Neutral
233
-
1,956
1,919
2,231
9.3
9.6
9.5
12.9
24.6
18.0
3.8
3.2
15.5
17.5
1.2
1.0
Quick Heal
Neutral
204
-
1,433
408
495
27.3
27.0
7.7
8.8
26.4
23.2
2.5
2.5
9.3
10.6
2.7
2.2
Radico Khaitan
Accumulate
136
147
1,806
1,667
1,824
13.0
13.2
6.7
8.2
20.4
16.6
1.8
1.7
9.0
10.2
1.5
1.3
Relaxo Footwears
Neutral
508
-
6,102
2,085
2,469
9.2
8.2
7.6
8.0
67.2
63.9
26.1
22.2
17.9
18.8
3.0
2.6
S H Kelkar & Co.
Neutral
260
-
3,753
1,036
1,160
15.1
15.0
6.1
7.2
42.5
36.2
4.5
4.2
10.7
11.5
3.5
3.1
Siyaram Silk Mills
Accumulate
2,214
2,500
2,076
1,574
1,769
12.5
12.7
97.1
113.1
22.8
19.6
3.5
3.0
15.4
15.5
1.5
1.4
Styrolution ABS India*
Neutral
943
-
1,659
1,440
1,537
9.2
9.0
40.6
42.6
23.2
22.1
59.3
53.9
12.3
11.6
1.1
1.0
Surya Roshni
Neutral
288
-
1,262
3,342
3,625
7.8
7.5
17.3
19.8
16.7
14.6
31.6
25.4
10.5
10.8
0.6
0.6
Team Lease Serv.
Neutral
1,450
-
2,479
3,229
4,001
1.5
1.8
22.8
32.8
63.7
44.2
6.8
5.9
10.7
13.4
0.7
0.5
The Byke Hospitality
Neutral
193
-
773
287
384
20.5
20.5
7.6
10.7
25.4
18.0
5.3
4.3
20.7
23.5
2.7
2.0
Transport Corporation of
Neutral
343
-
2,625
2,671
2,911
8.5
8.8
13.9
15.7
24.7
21.9
3.4
3.0
13.7
13.8
1.1
1.0
India
Stock Watch
July 07, 2017
Company Name
Reco
CMP
Target Mkt Cap
Sales ( Čcr )
OPM(%)
EPS (Č)
PER(x)
P/BV(x)
RoE(%)
EV/Sales(x)
(Č)
Price ( Č)
( Č cr )
FY17E FY18E FY17E FY18E FY17E FY18E FY17E FY18E FY17E FY18E FY17E FY18E FY17E FY18E
zOthers
TVS Srichakra
Neutral
3,902
-
2,988
2,304
2,614
13.7
13.8
231.1
266.6
16.9
14.6
438.4
345.2
33.9
29.3
1.3
1.1
UFO Moviez
Neutral
392
-
1,082
619
685
33.2
33.4
30.0
34.9
13.1
11.2
1.8
1.6
13.8
13.9
1.5
1.1
Visaka Industries
Neutral
519
-
824
1,051
1,138
10.3
10.4
21.0
23.1
24.7
22.4
66.5
62.3
9.0
9.2
1.0
1.0
VRL Logistics
Neutral
334
-
3,048
1,902
2,119
16.7
16.6
14.6
16.8
22.9
19.9
5.0
4.4
21.9
22.2
1.7
1.5
VIP Industries
Accumulate
196
218
2,771
1,270
1,450
10.4
10.4
5.6
6.5
35.0
30.2
7.3
6.3
20.7
21.1
2.2
1.9
Navin Fluorine
Buy
3,034
3,650
2,987
789
945
21.1
22.4
120.1
143.4
25.3
21.2
4.1
3.5
17.8
18.5
3.7
3.0
Source: Company, Angel Research; Note: *December year end; #September year end; &October year end; Price as on July 06, 2017
Market Outlook
July 07, 2017
Research Team Tel: 022 - 39357800
DISCLAIMER
Angel Broking Private Limited (hereinafter referred to as “Angel”) is a registered Member of National Stock Exchange of India
Limited,Bombay Stock Exchange Limited and Metropolitan Stock Exchange Limited. It is also registered as a Depository Participant with
CDSL and Portfolio Manager with SEBI. It also has registration with AMFI as a Mutual Fund Distributor. Angel Broking Private Limited is a
registered entity with SEBI for Research Analyst in terms of SEBI (Research Analyst) Regulations, 2014 vide registration number
INH000000164. Angel or its associates has not been debarred/ suspended by SEBI or any other regulatory authority for accessing
/dealing in securities Market. Angel or its associates/analyst has not received any compensation / managed or
co-managed public offering of securities of the company covered by Analyst during the past twelve months.
This document is solely for the personal information of the recipient, and must not be singularly used as the basis of any investment
decision. Nothing in this document should be construed as investment or financial advice. Each recipient of this document should make
such investigations as they deem necessary to arrive at an independent evaluation of an investment in the securities of the companies
referred to in this document (including the merits and risks involved), and should consult their own advisors to determine the merits and
risks of such an investment.
Reports based on technical and derivative analysis center on studying charts of a stock's price movement, outstanding positions and
trading volume, as opposed to focusing on a company's fundamentals and, as such, may not match with a report on a company's
fundamentals. Investors are advised to refer the Fundamental and Technical Research Reports available on our website to evaluate the
contrary view, if any.
The information in this document has been printed on the basis of publicly available information, internal data and other reliable
sources believed to be true, but we do not represent that it is accurate or complete and it should not be relied on as such, as this
document is for general guidance only. Angel Broking Pvt. Limited or any of its affiliates/ group companies shall not be in any way
responsible for any loss or damage that may arise to any person from any inadvertent error in the information contained in this report.
Angel Broking Pvt. Limited has not independently verified all the information contained within this document. Accordingly, we cannot
testify, nor make any representation or warranty, express or implied, to the accuracy, contents or data contained within this document.
While Angel Broking Pvt. Limited endeavors to update on a reasonable basis the information discussed in this material, there may be
regulatory, compliance, or other reasons that prevent us from doing so.
This document is being supplied to you solely for your information, and its contents, information or data may not be reproduced,
redistributed or passed on, directly or indirectly.
Neither Angel Broking Pvt. Limited, nor its directors, employees or affiliates shall be liable for any loss or damage that may arise from
or in connection with the use of this information.